
Export Data as a .csv (Admin Only)
Analyze Clients Needs at Intake via "Initial CAFAS" Assessments (Admin Only)
Analyze Outcomes at Discharge via "Exit CAFAS" Assessments (Admin Only)
Generate a List of Raters (Admin Only)
The Data Export feature is most useful when importing the data into another data analysis tool, such as Microsoft ACCESS or SPSS. However, we understand that not all users have access to these programs, so here we've included some helpful tips for using the Data Export to generate a .csv and opening it in Microsoft Excel.
We'll start by going over the process of exporting data into the .csv format.
Go to the Data Export module by clicking Data Export in the left navigation.
Select the criteria you'd like you'd like to use, and under Export Details be sure to mark CSV for your Export Type:

For Export Variables, select any pieces of information you would like to analyze, but also be sure to add the “Difference/Change/Improvement” indicators below. Selecting these items will pre-calculate outcomes for you, making outcomes analysis as simple as filtering a column in Excel (more details later).
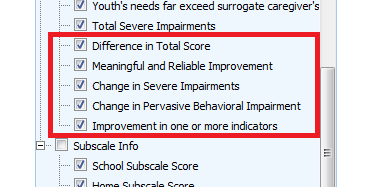
If you have any questions about any of the criteria or export variables, click on the "Help" link at the top right of the screen.
Once you click to export, your export request will be placed in a queue. Progress of the export can be monitored on the “Export Requests” tab:

The size of your export will determine how long it takes for the export to run. Once the export completes (the status will change to “Completed”), save it to your computer and open it in Microsoft Excel.
Note: The method discussed below will use the Initial CAFAS administration to determine client needs at entry to services. While this method can be a useful quick indicator of needs at entry to services, please keep in mind that the results of the analysis will only be as thorough as your organizations’ success rate at performing an Initial CAFAS at intake.
Once you have your data exported in the CSV format (see Exporting Data as a .csv above), determining needs at Intake via Initial assessments is actually quite simple. All Initial assessments are grouped together and labeled with a common set of variable names that start with “CAFAS_E1TInitial_”, “CAFAS_E2TInitial_”, “CAFAS_E3TInitial_”, where E1, E2, E3, etc simply refers to the episode. So, you might find column names like:
CAFAS_E1TInitial_clientAge – This is the client’s age at the time the Initial assessment was administered in the FIRST episode
CAFAS_E2TInitial_clientAge – This is the client’s age at the time the Initial assessment was administered in the SECOND episode
CAFAS_E1TInitial_assessDate - This is the date of the Initial assessment in the first episode
CAFAS_E3TInitial_assessDate - This is the date of the Initial assessment in the third episode
To analyze needs at Intake via Initial CAFAS assessments, simply do the following:
Open the .csv and look for the column headings named something like “CAFAS_E1TInitial_”. Under these column headings, you will find the data for all clients that matched your export criteria where an Initial assessment was conducted in the first Episode.

Note: the actual column names in your export will vary from what is shown based on your selection of “Export Variables” while creating the export file. If your export does not contain the variables shown and you would like to analyze those variables, re-export your data with those variables selected in the “Export Variables” section of the export.
Add filters to all of the column headings
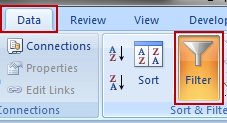
Filter the “CAFAS_E1TInitial_episodeNum” by clicking the filter menu and unchecking “(Blanks)”.
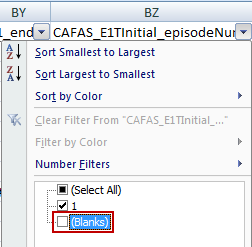
By filtering a column like “_episodeNum” that is not an optional piece of data, you can be sure that you are now looking at every case in your export data that had an Initial assessment in the first Episode. If you accidentally filter on an optional column, like “CAFAS_E1TInitial_TotalScore”, you will not be guaranteed to get every case with an Initial assessment because assessments do not have a Total Score unless all subscales are rated. So, be sure to choose a mandatory field. Use “_episodeNum” if you are uncertain. In this example, there are thirty-five cases with Initial assessments in the first episode:
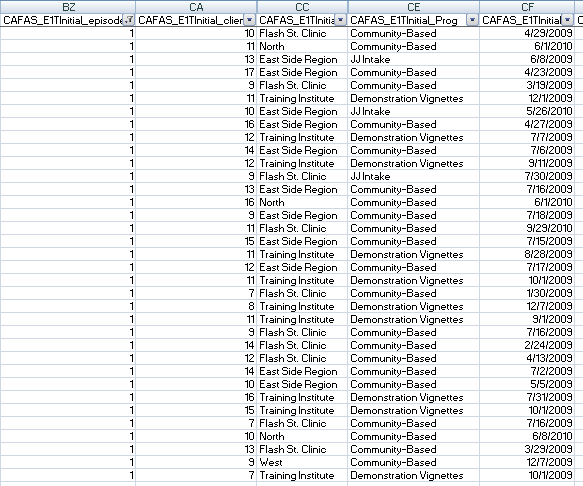
From here, calculating needs on Initial assessments is as easy as using Excel Functions and/or pivot tables on the columns that have already been calculated by FAS Outcomes. Some useful columns are “CAFAS_E1TInitial_TotalScore”, “CAFAS_E1TInitial_Tier“, “CAFAS_E1TInitial_ChildMgmtSkills”, and ”CAFAS_E1TInitial_PervasBhImpair” among others.

For example, you may want to calculate the following (note that your column letters will be different based on the Export Variables you chose during export so be sure to adjust the formulas accordingly):
The Average Total Score at Initial assessment: =AVERAGE(CX:CX)
110.33 in the above example
The number of clients in the “Thinking Problems” CAFAS Tier at Initial: =COUNTIF(CY:CY,"Thinking Problems")
4 in the above example
The number of clients where improving Child Management skills may be a potential treatment option: =COUNTIF(CZ:CZ,"TRUE")
13 in the above example
The percent of clients with Pervasive Behavioral Impairment: =COUNTIF(DA:DA,"TRUE")/(COUNTA(BZ:BZ)-1)
45.7% in the above example
Note that, once again, a required column (“_episodeNum” … “BZ”) is used to count the total number of clients in the denominator. That way, clients without a total score (and therefore without a Pervasive Behavioral Health indicator) will still be counted.
Note that the “-1” in the denominator is simply to avoid counting the column header
That’s it! From here you can perform any additional calculations to fit your needs. Other ideas would include filtering on the Service Area and Program codes to see needs at Intake by Service Area and Program. You can also evaluate other episodes by performing the same analysis on the variables that start with “CAFAS_E2TInitial_”, “CAFAS_E3TInitial_”, etc.
Note: The method discussed below will use the “Exit CAFAS” administration to determine outcomes at exit or discharge from services. It is understood that in most organizations, it is not possible to assess EVERY youth at exit due to the unpredictable nature and variety of ways that clients exit services. So, while this method can be a useful quick indicator of outcomes at exit, please keep in mind that the results of the analysis will only be as thorough as your organizations’ success rate at performing an “Exit CAFAS” at discharge.
Once you have your data exported into a .csv format (see Exporting Data as a .csv above), determining outcomes at Exit is actually quite simple. All Exit assessments are grouped together and labeled with a common set of variable names that start with “CAFAS_E1TExit_”, “CAFAS_E2TExit_” , “CAFAS_E3TExit_”, where E1, E2, E3, etc simply refers to the episode. So, you might find column names like:
CAFAS_E1TExit_clientAge – This is the client’s age at the time the Exit assessment was administered in the FIRST episode
CAFAS_E2TExit_clientAge – This is the client’s age at the time the Exit assessment was administered in the SECOND episode
CAFAS_E1TExit_assessDate - This is the date of the Exit assessment in the first episode
CAFAS_E3TExit_assessDate - This is the date of the Exit assessment in the third episode
To analyze outcomes at Exit, simply do the following:
Open the .csv and look for the column headings named something like “CAFAS_E1TExit_”. Under these column headings, you will find the data for all clients that matched your export criteria where an Exit assessment was conducted in the first Episode.

Note: the actual column names in your export will vary from what is shown based on your selection of “Export Variables” while creating the export file. If your export does not contain the variables shown and you would like to analyze those variables, re-export your data with those variables selected in the “Export Variables” section of the Export.
Add filters to all of the column headings

Filter the “CAFAS_E1TExit_episodeNum” by clicking the filter menu and unchecking “(Blanks)”.
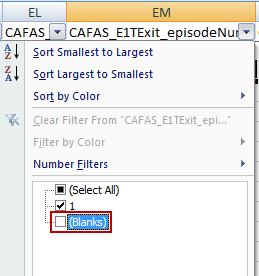
By filtering a column like “_episodeNum” that is not an optional piece of data, you can be sure that you are now looking at every case in your export data that had an Exit assessment in the first Episode. If you accidentally filter on an optional column, like “CAFAS_E1TExit_TotalScore”, you will not be guaranteed to get every case with an Exit assessment because assessments do not have a Total Score unless all subscales are rated. So, be sure to choose a mandatory field. Use “_episodeNum” if you are uncertain. In this example, there are only two cases with Exit assessments in the first episode:

From here, calculating outcomes on Exit assessments is as easy as using Excel functions and/or pivot tables on the “Difference/Change/Improvement” columns that have already been calculated by FAS Outcomes. Those columns are named “CAFAS_E1TExit_TotalScoreDiff”, “CAFAS_E1TExit_MeaningfulReliableDiff “, “CAFAS_E1TExit_SevereDiff”, ”CAFAS_E1TExit_PervasiveImpairDiff”, and “CAFAS_E1TExit_IndicatorImprove”.

For example, you may want to calculate the following (note that your column letters will be different based on the Export Variables you chose during export so be sure to adjust the formulas accordingly):
The Average change in score at Exit: =AVERAGE(GA:GA)
65 in the above example
The number of clients with no severe impairments at Exit: =COUNTIF(GC:GC,"Improved")
1 in the above example
The number of clients who still have severe impairments at Exit: =COUNTIF(GC:GC,"Not Improved")
1 in the above example
The percent of clients with Meaningful and Reliable improvement at Exit: =COUNTIF(GB:GB,"Improved")/(COUNTA(EM:EM)-1)
100% in the above example
Note that, once again, a required column (“_episodeNum” … “EM”) is used to count the total number of clients in the denominator. That way, clients without a total score (and therefore without a Pervasive Behavioral Health indicator) will still be counted.
Note that the “-1” in the denominator is simply to avoid counting the column header
That’s it! From here you can perform any additional calculations to fit your needs. Other ideas would include filtering on the Service Area and Program codes to see outcomes at Exit by Service Area and Program. You can also evaluate other episodes by performing the same analysis on the variables that start with “CAFAS_E2TExit_”, “CAFAS_E3TExit_”, etc.
Note: The method discussed below will use the “Initial CAFAS” administration to determine a list of client raters. While this method can be a useful quick indicator of which clients were served by which raters, please keep in mind that the results of the analysis will only be as thorough as your organizations’ success rate at performing an “Initial CAFAS” at intake.
If your organization assigns a single rater, such as a Case Manager, to a client, generating a list of raters (and the clients they work with) is as simple as finding the rater (“assessor”) on the Initial assessment. This can be done very easily using a .csv export.
To generate a list of raters for Initial assessments, do the following:
Note: If you are looking for a list of raters on any specific type of assessment (i.e. “Initial”, “Exit”, “3 month”, etc) you can still use the steps below. If you would like to retrieve all raters for any type of assessment, see the final paragraph in this section after the numbered steps below.
Generating a list of raters on Initial assessments follows a very similar process to identifying client needs at Intake. The first few steps are:
Create an export file
Filter the file to show only Initial assessments
For more details on how to perform these steps, please consult the section Analyzing clients needs at Intake via “Initial CAFAS” Assessments above.
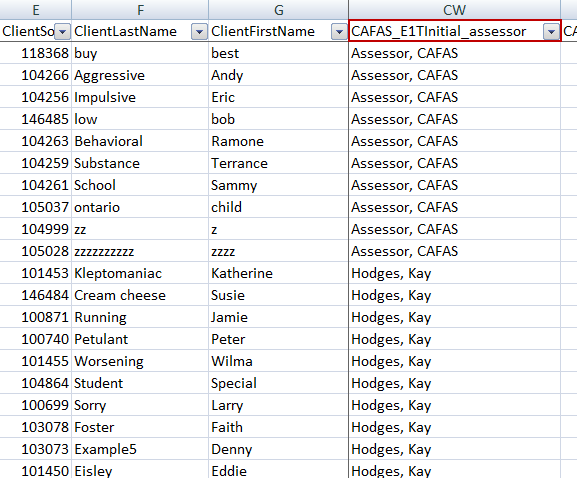
Once you have your filtered list of Initial assessments, you can simply find the “CAFAS_E1TInitial_assessor” column. This is your list of raters/assessors for all Initial assessments for your clients. You may find it helpful to sort by the “CAFAS_E1TInitial_assessor” column or create a pivot table in order to group clients by assessor and see all of the clients served by the same assessor together. For Example, using the sample data from the “Analyzing clients needs at Intake via “Initial CAFAS” Assessments” section:
If you are interested in preparing a list of ALL raters that have assessed a client (i.e. not just the Initial assessment), the fastest way to do that is to export the data into a relational database format and run the query below. If you’re not sure how to get the data into a relational database format, learn to load export data into ACCESS or SQL Server. The query to list all raters and the clients they have worked with is:
SELECT details.Assessor, basicInfo.id1 as clientID, basicInfo.cLastName, basicInfo.cFirstName, details.Assessment_Administration_Type
FROM assessDetails as details INNER JOIN basicInfo ON (details.id1 = basicInfo.id1)
ORDER By details.Assessor